


By: Andrew Saponara
Last month in Climate 101, we discussed the different emission classifications, scopes 1, 2, and 3. Of these, scope 3, which includes commuting, business travel, and food emissions, is the most difficult to track. Tracking emissions is crucial in helping Rutgers meet its climate goal of becoming carbon neutral by 2040. It will assess how much progress Rutgers has made toward achieving its goals and will help identify procedures that can be made more efficient.
You may be wondering how we track food emissions. An important component of this calculation is food miles. Food miles measure the distance from where the food is produced to where it is consumed and the emissions created from this process. Other factors such as food type, if the food is locally sourced, associated food waste, and the resources required to produce the food contribute to food emissions as well.
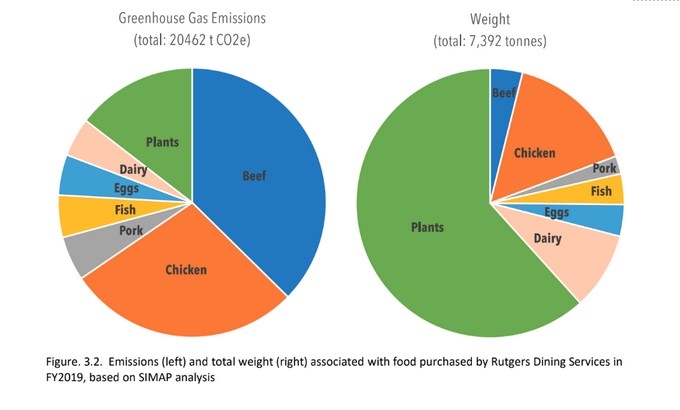
According to the Food and Water Systems working group of the President’s Task Force on Carbon Neutrality and Climate Resilience, food emissions from Dining Services account for 7% of Rutgers’ annual GHG emissions. The leading source of food emissions in dining halls is beef accounting for 36% of food-related emissions, yet it only comprises 4% of the weight of foods purchased. Meanwhile, plant-based foods account for 15% of overall emissions and account for 62% of the weight of food purchased.
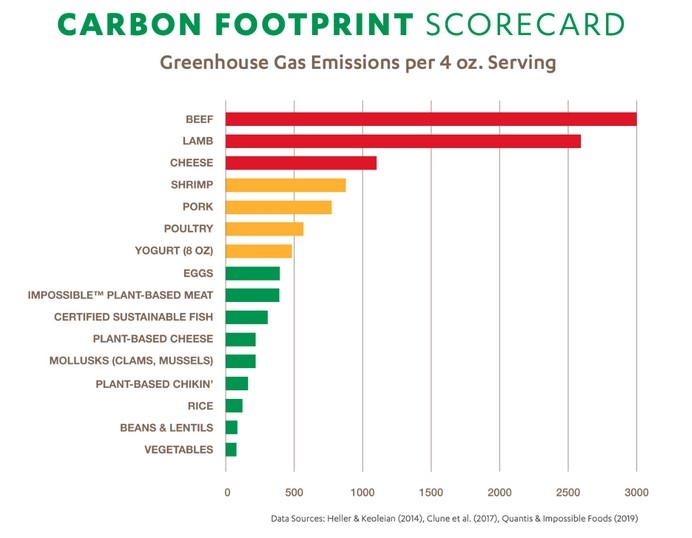
Meat production is an extremely inefficient use of resources; it requires large amounts of energy and land to grow crops, and thousands of gallons of water to produce one pound of beef. Factors such as whether the food is processed or fresh, how it is packaged, and the amount of ingredients used to make it all contribute to a product’s carbon footprint. One of the most significant ways of reducing your carbon footprint is by eating less meat, and incorporating more local plant-based foods into your diet as a substitute.
The USDA estimates that food waste accounts for 30-40% of the food supply each year. The Dinning Services and Food Vendors CAG is working on gathering data on how much food waste is produced at dining halls, so that Rutgers can work to support the State of New Jersey’s plan to reduce 50% of food waste by 2030. The Food and Water Systems WG3 has identified solutions to reduce both on and off-campus emissions. Rutgers Dining services can change their menu to include more plant-based options, source produce that is local and in-season, and create awareness campaigns to educate students and faculty how to eat more sustainably and waste less food.
For some students at Rutgers, eating more sustainably is simply a lifestyle choice, but for others, eco-friendly food choices are inaccessible due to cost, time, or availability of grocery stores. According to a 2016 survey from the Rutgers Student Food Pantry, 36.9% of undergraduates and 32.1% of graduate students faced food insecurity. The pandemic and recent downturn in the economy have made food insecurity worse since then. It is important to view our work at Rutgers through the lens of climate justice and consider ways to decrease food-related emissions while making healthy climate-friendly food options more accessible to our community.
Rutgers and our host communities offer several options for food assistance. We encourage anyone who is facing food insecurity to use the resources below:
Supplemental Nutrition Assistance Program (SNAP)
New Jersey Agricultural Experiment Station Resource List
Camden
Newark
New Brunswick